Tourism Research and Statistics
Waco Tourism Statistics
We provide these official statistics for your convenience. Please credit the Waco Convention & Visitors Bureau if you use these statistics.

Attendance numbers are reported by the following attractions: Armstrong Browning Library, Art Center Waco, Cameron Park Zoo, Dr Pepper Museum, Historic Waco Foundation, Lake Waco Wetlands, Magnolia Market, Mayborn Museum Complex, Texas Ranger Museum, Texas Sports Hall Of Fame, Waco Civic Theatre, Waco Mammoth National Monument, Balcones Distilling (as of January 2021), Waco Surf (as of March 2023), and Waco Welcome Center.
Note: November and December 2023 numbers are conservative estimates based on trends due to some entities having counter issues.
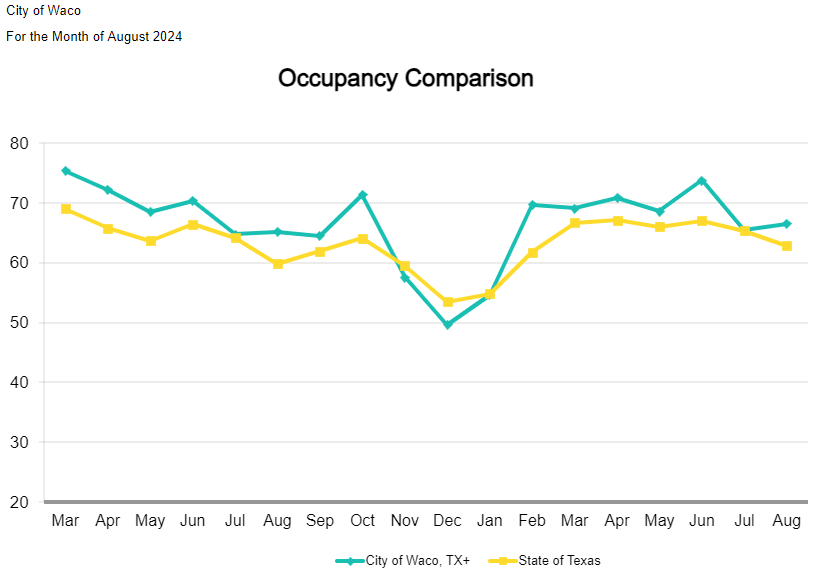
Waco Hotel Occupancy & Average Daily Rate vs. State of Texas

Data from Smith Travel Research
Travel Statistics
From the Office of the Governor, Texas Economic Development & Tourism
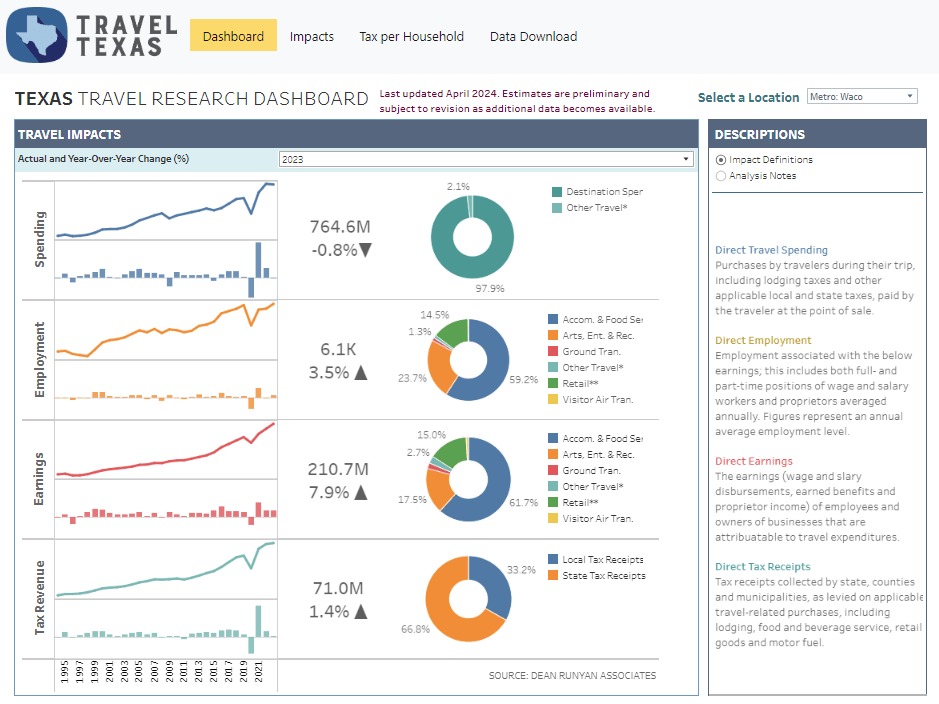
2023 Travel Economic Impact Overview – Waco MSA
- Direct Travel Spending – $765 million – down 0.8% from 2022
- Direct Employment – 6.1 thousand jobs – up 3.5% over 2022
- Direct Earnings – $210.7 million – up 7.9% over 2022
- Direct Tax Receipts Generated by Travel Spending – $71 million – up 1.4% over 2022
2023 Travel Economic Impact Overview – Texas Brazos Heritage Trail Region
- Direct Travel Spending – $3.8 billion – up 2.5% from 2022
- Direct Employment – 32.4 thousand jobs – up 4.3% over 2022
- Direct Earnings – $1.2 billion – up 8.3% over 2022
- Direct Tax Receipts Generated by Travel Spending – $376.3 million – up 4.0% over 2022
For additional statistics, please visit: https://www.travelstats.com/impacts/texas

